Fleet Maintenance System Using MS Project
Fleet maintenance system
A few years ago, I was a planning superintendent at a large mine overseas. We had several Komatsu 930 mining trucks, which are some of the largest in the world at 320 tons, featuring a 2700 hp diesel electric propulsion system.

Komatsu 930 truck
You can download the brochure from their site:
https://www.komatsu.com/en/products/trucks/electric-drive-mining-trucks/930e-5/
Maintenance was performed using SAP (the company wide system) and there was an excel spreadsheet to predict future maintenance, up to two weeks ahead.
As you can imagine, the maintenance on these pieces of equipment is very complex and excel just doesn’t cut it so I used an MS Project system I had devised a few years earlier, better suited to the task.
This system can be used on all kind of pieces of equipment, cars, trucks, excavators, drills, etc…
This system has everything I needed but can be simplified to suit your needs:
So here is some basic information about the problem (this is just an example, do not use these numbers in real life)
- 5 trucks (this system can easily do 100)
- They all start at different hours
- Basic maintenance is every 250 hrs (on average)
- They can have several different types of maintenance packages as the trucks are slightly different models/year (I’ll only use one in this example, but it’s easy to scale up)
- Additional maintenance tasks and materials are required every 500, 1000, 3000 and 4000 hours
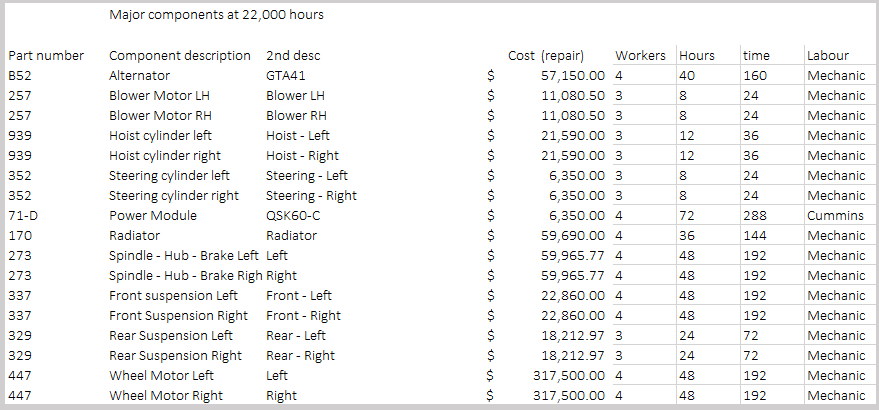
- A major overhaul is required at 22,000 hours (large component changes like wheel motors, hydraulic cylinders, suspension, radiator, etc.)
- Their workday varies between 13 and 20 hours, average is 17.
OBJECTIVE:
Create a maintenance planning system to optimize the maintenance and thus operation of a fleet;
- Produce more with less resources
- Increased profits
- Reduce environmental impact
- Maintain the equipment in the safest conditions possible
STEPS:
1 – Initial setup MS Project
2 – Determine the Maintenance Requirements of the Equipment
3 – Present state of maintenance (last service, hours, etc.)
4 – Enter data in MS Project, create a schedule for the next two years
5 – Learn to update the schedule regularly
6 – Determine resources required
7 – Add resources to plan
8 – Prepare short term/long term plans and reports
1 – Initial setup MS Project
Let’s start our first schedule with only 5 trucks (or cars, drills, excavators, etc.)
I’m using MS Project Professional 2019
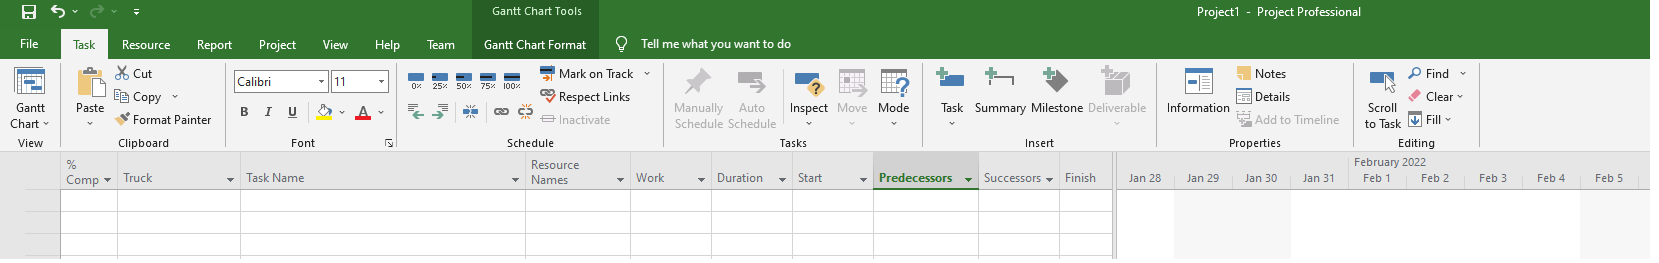
Setup the columns as follows (New “Truck” Column) with
%Complete, Truck (Text1 column), Task Name, Resource Names, Work, Duration, Start, Predecessors, Successors, set the time scale to Month/Days
01 - Initial Setup MS Project
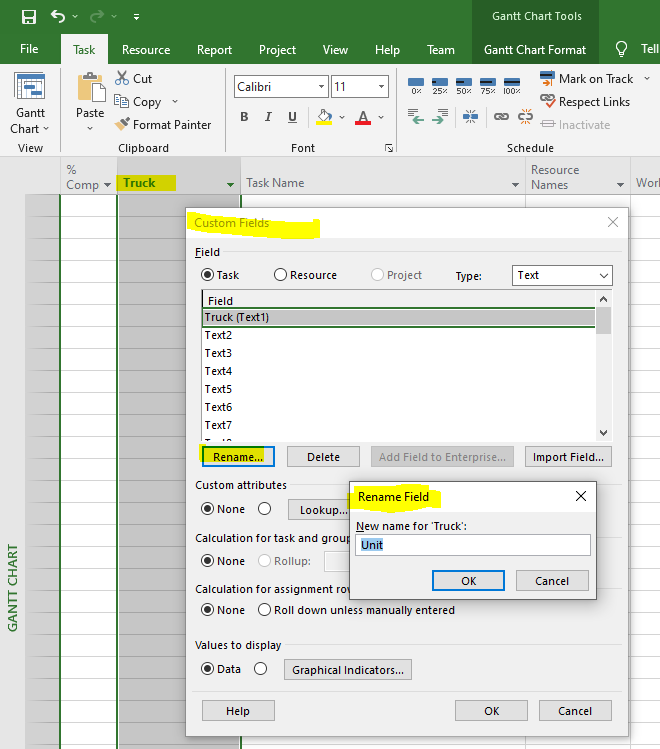
I like to set daily vertical gridlines:
02 - Vertical gridlines
And Gantt Rows every 4 lines for clarity:

03 - Gantt rows
Like this

04 - Initial Setup
New tasks are auto scheduled, bottom left of the window

05 - Auto scheduled
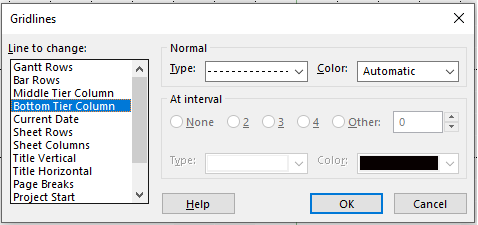
Let’s rename “Text1” in Custom Fields to “Units”
06 - Rename field
Add a nice blue vertical line at the Status date
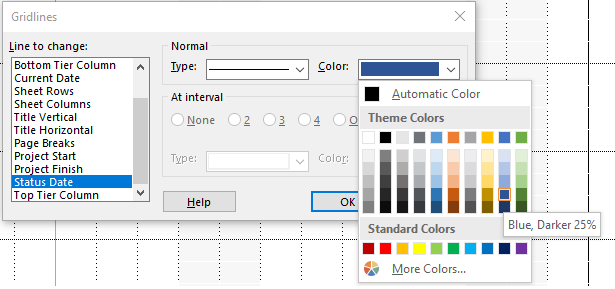
07 - Status date
I like a blue bar and black line for progress in Bar Styles

08 - Progress
2 – Determine the Maintenance Requirements of the Equipment
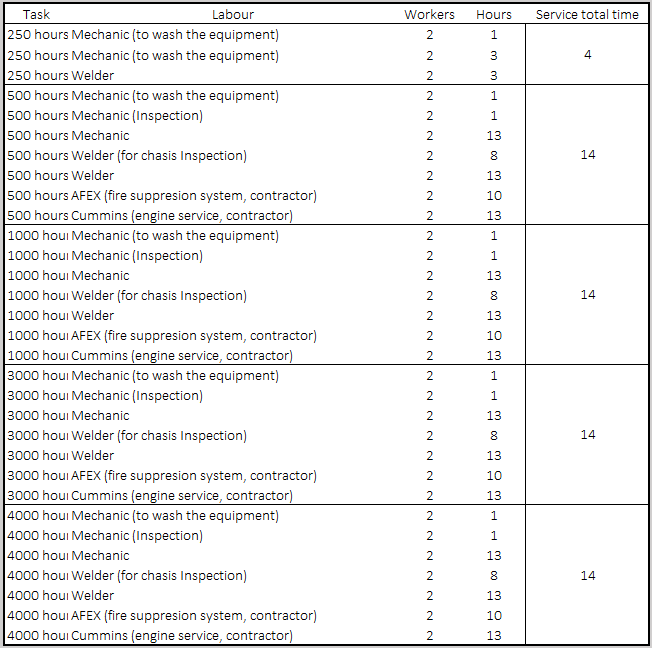
For most equipment, the manuals will require periodical services, they can be in KM or miles (like for your car) or in hours, in the case of industrial equipment. In this case, here are the intervals we will use, and how long the equipment must be out of work (including travelling time to the shop)
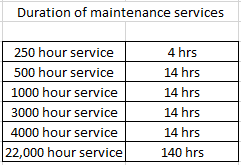
09 - Maintenance durations
Say we had a brand-new piece of equipment, the first 12,000 hr would look like this

10 - Theoretical services
But we don’t have new equipment as this is a running concern. We must estimate how many hours the equipment is working per day, on average.
Trucks must stop for refuelling, shift changes, maintenance, and operational requirements. Every truck will be different, but we need to make and assumption for our planning.
By averaging all the accumulated hours, we find that the trucks were adding an average of 17 hours per day for the last year. Let’s use that number for all the trucks for our future planning.
Our weekly/daily schedule updates will correct any discrepancy and accurately predict our short-term planning.
Resource loading for our long-term plan will be very close to actual as we are using the average of all the trucks.
3 – Present state of maintenance (last service, hours, etc.)
You will need to know the initial state of your fleet in terms of were the last and when are the next services (assuming 17 hours per day of production):

11 - Present state
In the case of Truck-01 for example, we know that there will be 138 hours of production before the next service, after the initial hours.
A note here on the 250-hr interval between services; it rarely happens exactly on time. Just like the service on your car is never exactly at say every 10,000km because the equipment is busy, the shop is not ready, you’re a bit ahead (of course, we’re planners after all), etc.… However, we maintain an average of 250 hrs between services.
It may be that it’s acceptable to sometime go beyond 250 hrs (say 300 hours) and then do the next maintenance at 250 but then your average is over 250 hours between services, and I don’t know how it affects the warranty or reliability of your equipment. Let management decide.
4 – Enter data in MS Project, create a schedule for the next two years
Setup a new calendar for Trucks, 17 hours per day (the average workday for all the trucks last year), 7 days a week. The from/to hours, 12 am to 5 pm which in this case, doesn’t really matter.
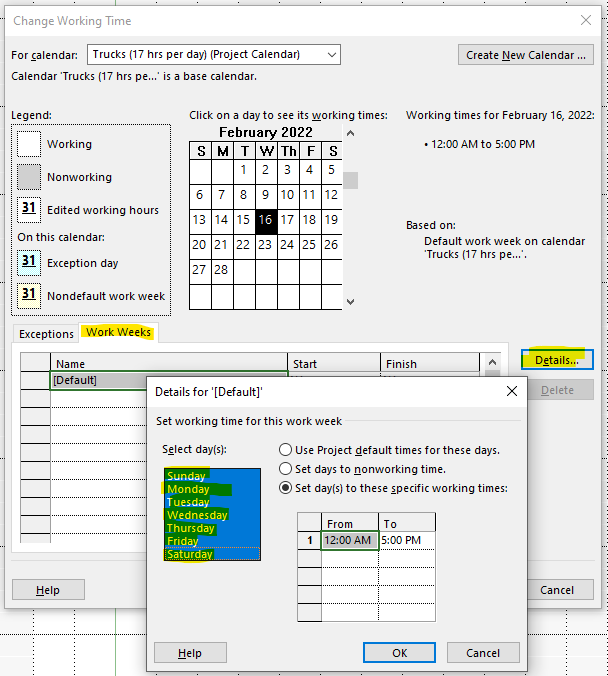
12 - Project calendar
Make it the project calendar and set the Project Start date on the 20th of Jan or earlier, our earliest actual service date, and set the Status date on Feb 01, 2022 at 12:00AM
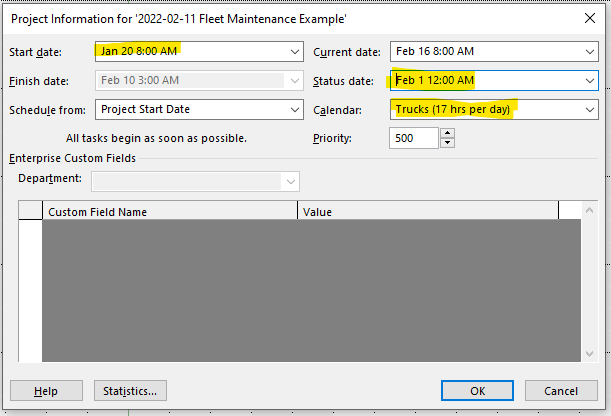
13 - Project information
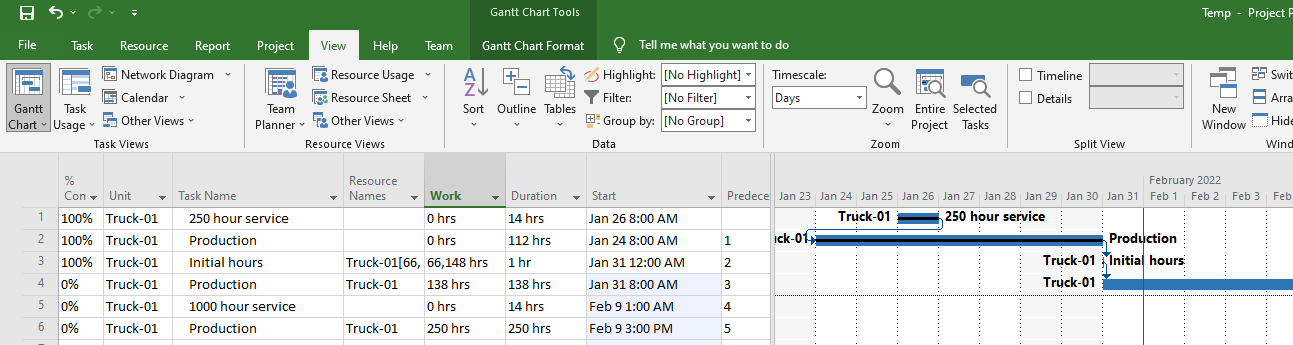
Let’s start with Truck 01.
First task is the 250-hr service, performed on Jan 26th, duration was 14 hours and it’s 100% completed.
Second task is the first 112 hour of production (250-138), also 100% completed, no resource on this first production activity (use finish to start relationships for all activities)
The third activity will be the 66,148 initial hours, (don’t worry about the start dates just yet), at 100% completed. Resource is Truck-01[66,148].
The fourth activity is the Production task, 138 hours to the next service, 0% completed, Finish to start relationship with the 66,148 initial hours and Resource Name “Truck-01”. All the production tasks will have the same “Truck-01” resource afterward, you will see why it’s important shortly.
Add the rest of the services and 250-hour production in between (again, with Truck-01 as a resource for production tasks only)
Right click on the Gantt chart and select Bar Styles. I like the truck number and the Task name on the left and right of the bars on the Gantt chart to add clarity, you can even print schedules without the columns this way.
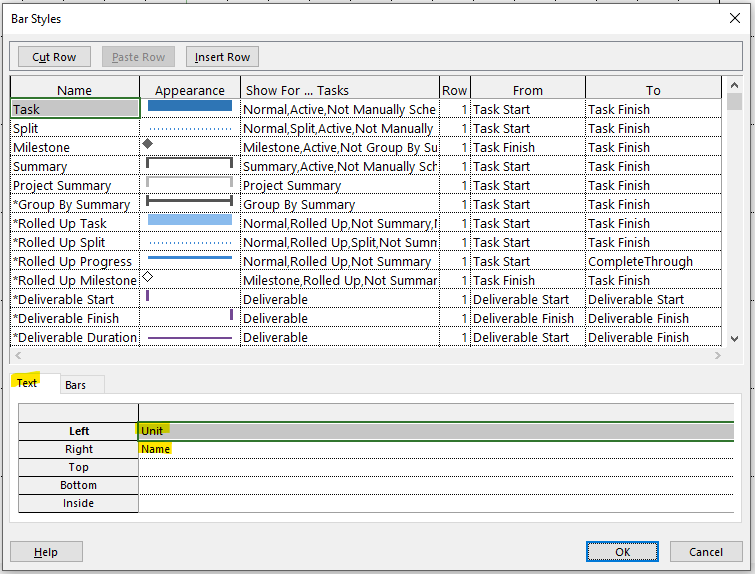
14 - Bar texts
This is what the result looks like
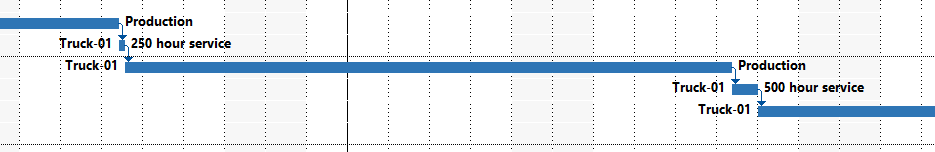
15 - Gantt bars text
Here we go for Truck-01. It really didn’t take that long using copy/paste and excel. I did the schedule for about two years (2022 and 2023).
Here’s another view

16 - Truck 01
Notice that initial hours are on Feb 2nd, but the readings were taken on the 1st. Let’s do our first update to correct the situation.
As task #2 and 3 are 100% completed, let’s drag them before the status date.
17 - Start update
And update the Project

18 - Update Truck 01
All your future services are now accurately predicted.
Notice that we are not particularly concerned about the past production tasks, when they started, or when they finished, they are only there to tabulate the truck hours. In future reports, what we’ll want to see are the service dates and hour meter readings, those will be accurate.
I’ve got a neat trick to show you before we add Trucks 02 to 05.
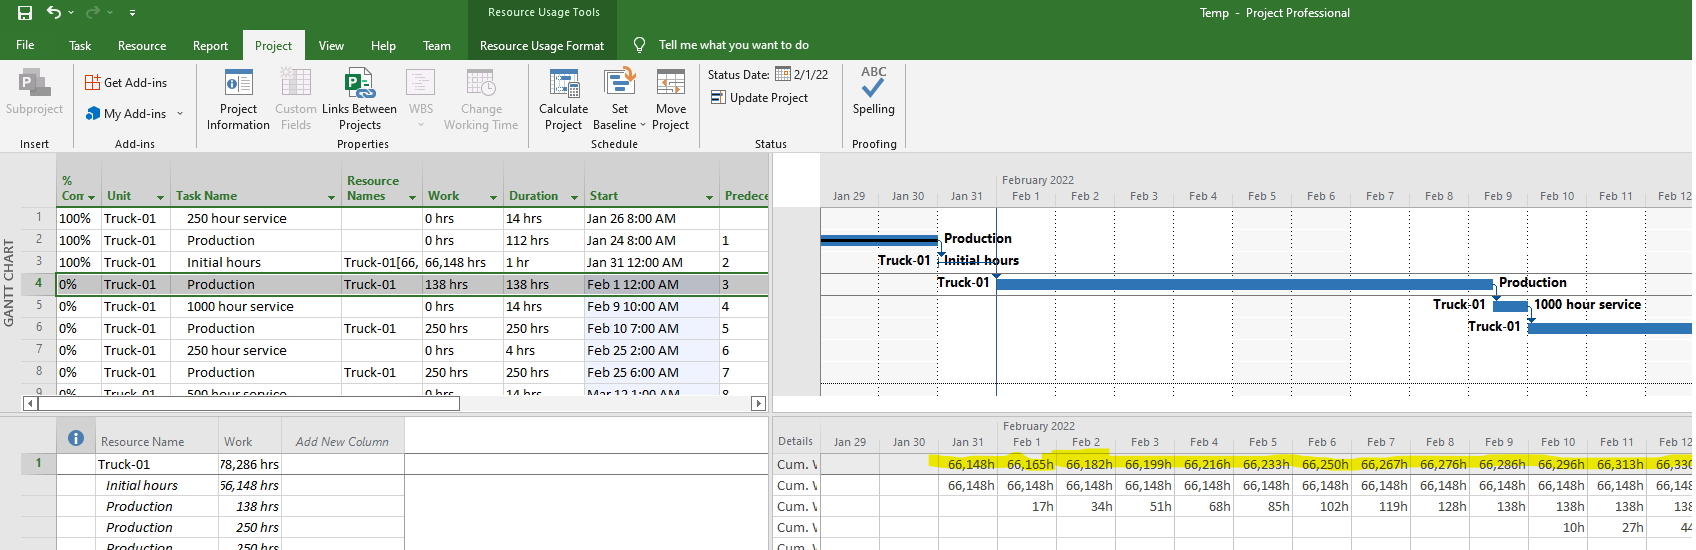
If I go Task -> Details, then switch from the “Task details form” on the bottom left to “Resource Usage” form
Specify “Cum. Work” under Details and Press on any “Production” task, and you will now see all the projected truck hours every day for the next two years, starting with Feb 1st hours (66,148 initial hours + 17-hour production the first day = 66,165).
19 - Cumulative work
Now do the same for trucks 2 to 5
After a bit of copy/paste, sorting and filtering, here are the dates for all the services for all the trucks for the next two years.
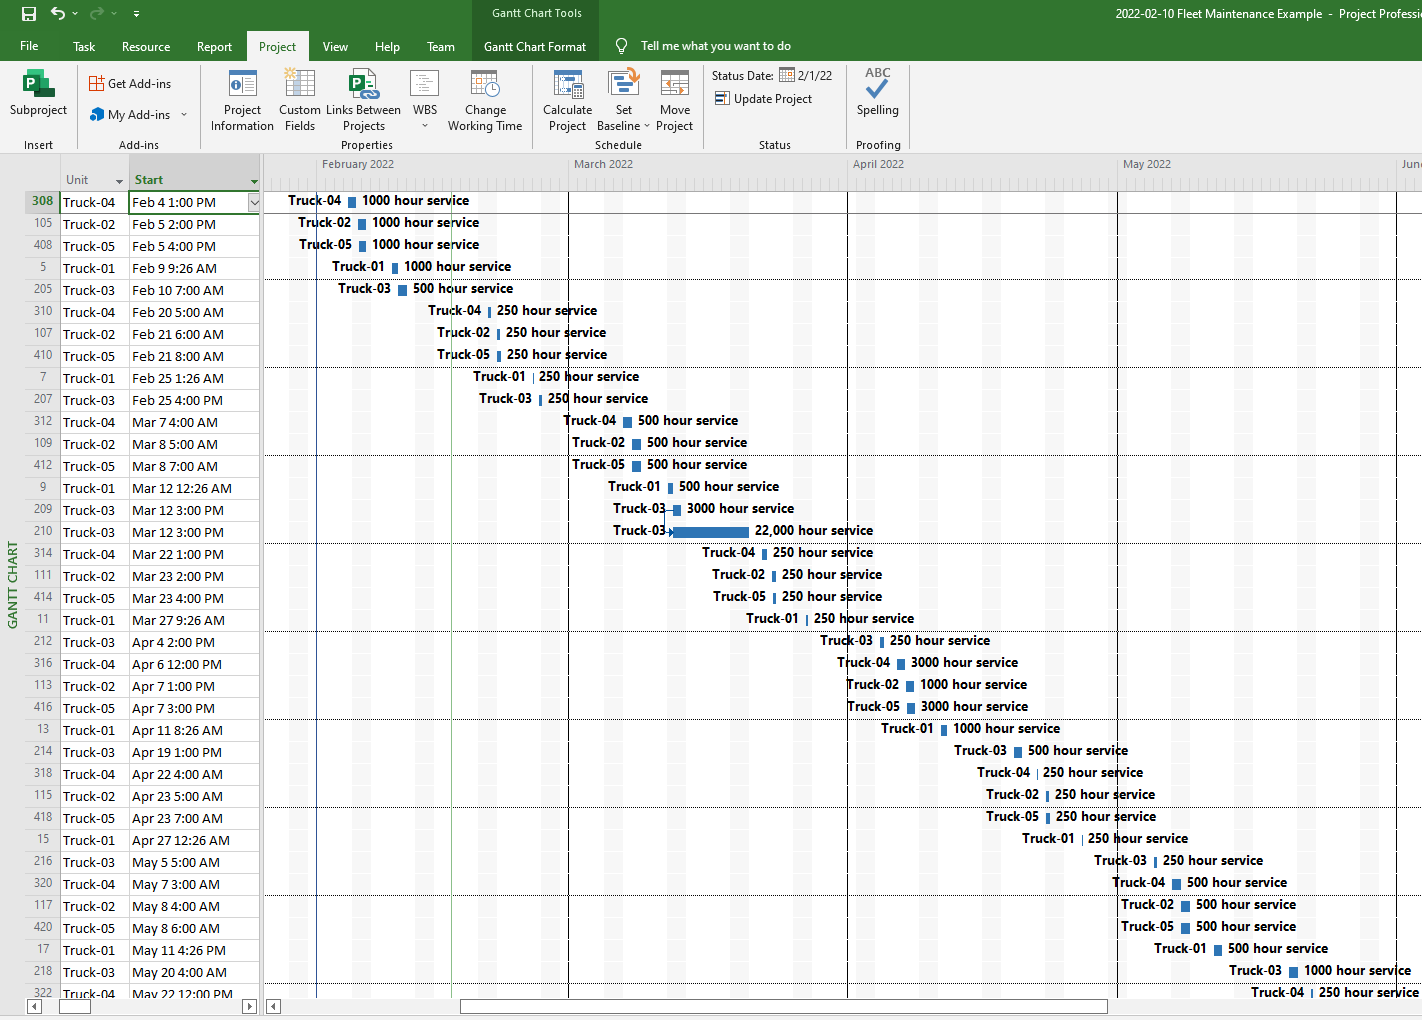
20 - Services
Looks a lot better than excel and when you have 100 pieces of equipment, it’s extremely helpful. But we’re not done yet.
5 – Learn to update the schedule regularly
As mentioned earlier, this is for an average of 17 hours a day of production and that rarely happens, some truck may even be immobilized some days, how do we account for that?
We do it by updating this schedule with actual hours once a week (or as required). This gives us an accurate plan for our shop and resources for the next week or two and automatically adjusts the next two years as well.
The schedule starts on Feb 1, 2022, say we update every Monday morning to prepare for the week (I’m just using Mondays for convenience here, use whatever date/interval is best for your purpose)
Let’s improve the look a bit before our first Update
Now let’s use “Group by” to create a new Group called “Trucks”.

21 - Group
Now select this new group and filter for a date range for the next three weeks. And bring back the resource usage panel at the bottom

21 - Three weeks
I prepared a fictitious scenario for our first update assuming that we are now Feb 7th. For clarity, I’m using Excel to calculate the next services. I always update using Project alone, but it may be easier for you to start with this, I’ll leave it to you.
For the first update, I’m using fictitious hour meter data for a few potential scenarios. Notice that there are different scenarios, some trucks are working more than 17 hours, some less, one was even broken down for a few days.
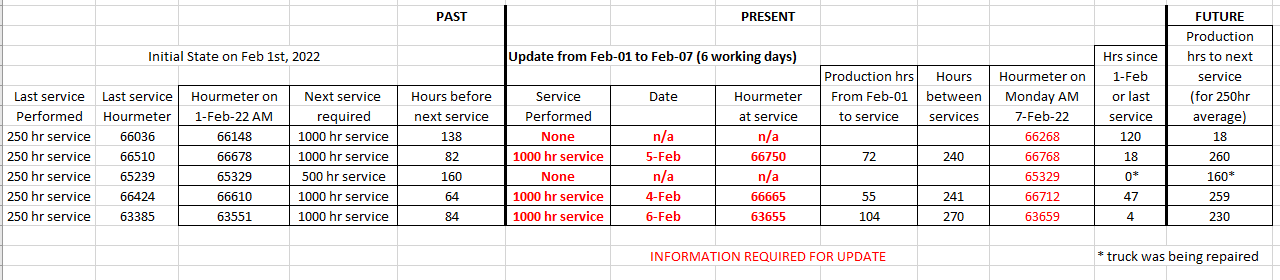
22 - Next update
For the present and future, I used simple formulas that you can create using “If” functions in excel. Like I mentioned earlier, you’ll be able to do it in your head after a few updates. This is also useful if you need to train new operators. (Actually, just send them here!)
There may be minor errors in Project for the exact time of day of the services because the %work and %completed are whole numbers, no decimals. Otherwise, it’s very accurate, within a few hours, and errors don’t accumulate as the real working hours are entered weekly.
To update, set your status date to the time the hours were entered, I’m using Feb 7th at 00:00 am, (or 12:00AM in Project)

23 - Update
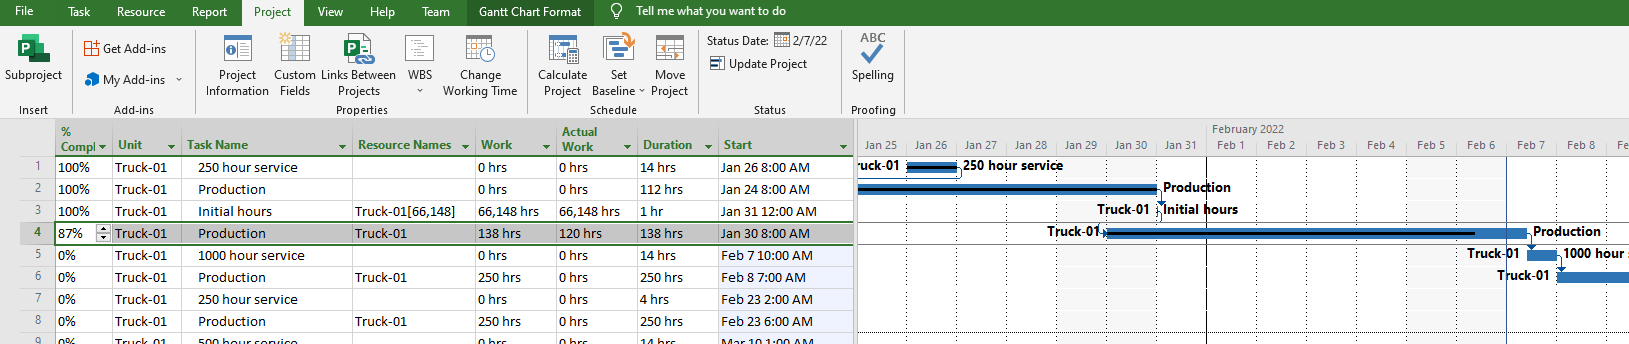
Truck 01 Update:
Add the “Actual Work” column next to the “Work” Column.
Per our spreadsheet, there was 120 hours of production during the week, enter it in the “Actual Work” column. % Complete will automatically adjust to 87%
As truck 01 worked an average of 20 hours per day this week, the progress is shown past the status line, in the future, we can’t have that.

24 - Update Truck 01
So grab the progress bar with your cursor (or set the start date earlier) and bring it back before the status line (I am not concerned about the location of the bar, bring it back enough not to have any progress in the future).
25 - Update Truck 01
Go to “Update Project” and Reschedule uncomplete work to start after the status date, use the “Selected tasks” button

26 - Update Truck 01
Et voila! Your hours at the end of the day on Feb 6th are accurately set at 66,268 and your 1000 hour service is planned for Feb 8th when the truck will reach 66,286 hours.

27 - Update Truck 01
Note that the production bar has a gap in the past, and the production work hours are not accurately located in the past. The reason is that we do not really care about the history of the production bars, we won’t even show them in our reports. We care that we’ll have a precise plan for the future, and we have an adequate record of past services.
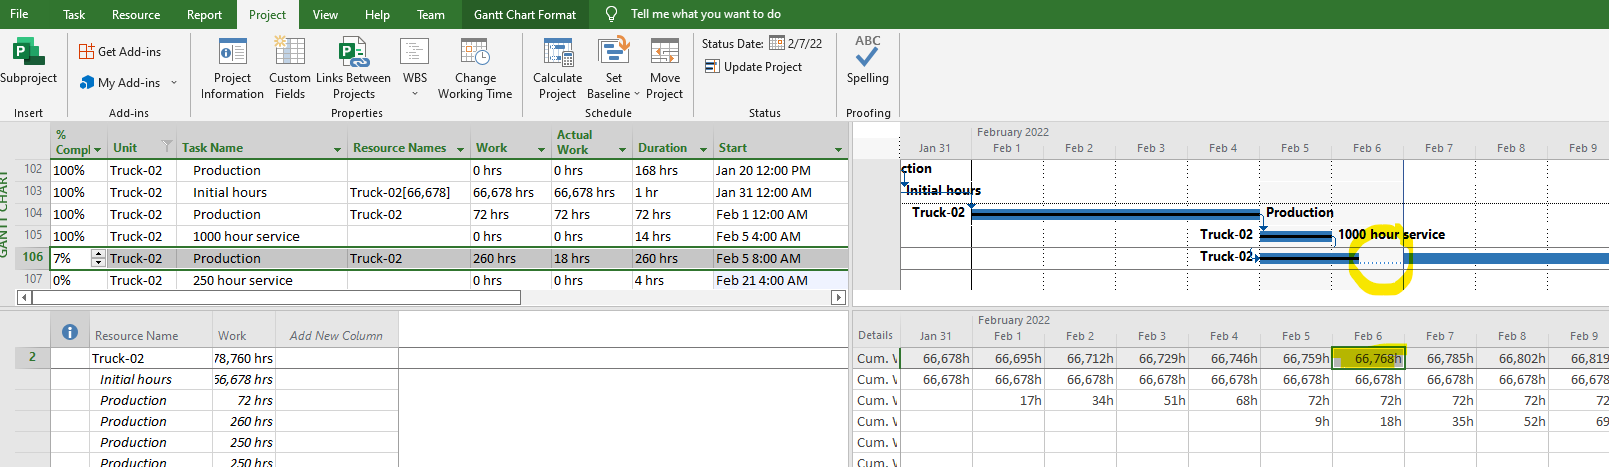
Truck 02 update:
Change production hours from Feb-01 from 82 to 72 hours (“Work” column), set task at 100% progress.
Change production hours after the 1000hr service from 250 to 260 hours in the “Work column” (to keep our 250-hour average production between services intact). There was 18 hours of production performed since the last service, set “Actual Work” column to 18 hours.
Set the 1000 hr service task at 100% complete, change the start date to 5-Feb as per actual date it was performed (oops! it was already planned for the 5th, no need to change it this time).
Update the project as before.
This is the result but there is a problem, the hourmeter just before the 7th should say 66,768 but our schedule shows 66,766. Why is that?

28 - Update Truck 02
It’s because if we were to zoom in on our timescale, we are actually showing progress two hours in the future, which is not clear at all in our daily timescale above.

30 - Update Truck 02
So in the future, keep a gap between progress and status date to avoid this discrepancy. The 100% complete, 1000 hour service remains where it is.
31 - Update Truck 02
Truck 03 update:
There was no work performed by truck 03 this week, so no change in % complete, just do a project update.

32 - Update Truck 03
Truck 04 update:
Set production hrs (“Work” column) from Feb-01 to service from 64 hrs to 55, per our spreadsheet, set task as 100% complete.
Change the following 250 hrs production task to 259 hrs to compensate, set actual work at 47 hours, which gives us 18% complete.
Bring back this production bar so the progress is in the past.
Set 1000 hour service at 100% complete, it’s already on Feb 4th so no need to change the start date.
Update the project check the hours on Feb 6th.

33 - Update Truck 04
Truck 05 update:
Set production hrs (“Work” column) from Feb-01 to service from 84 hrs to 104, per our spreadsheet, set task as 100% complete.
Reduce the following 250 hrs production task to 230 hrs to compensate, set actual work at 4 hours, which gives us 2% complete.
Bring back this production bar so the progress is in the past.
Set 1000 hour service at 100% complete, and change the start date to Feb 6th, as per actual service date.
Update the project check the hours on Feb 6th and…
The hours don’t match!
The error stems from the 104 hour production task. Look at the finish date, there is 2 hours of progress in the future which the bar doesn’t show on this daily timescale.

34 - Update Truck 05
Bring it back to fix the issue.

35 - Update Truck 05
And your update is done, you can prepare a useful report on the next two weeks.
Adding resources:
Once your schedule is established, we can add resources to the tasks. The advantage is that you only have to do this once, afterwards, you can extract any information you want in terms of you future costs, materials and labour that you’ll require for any given period.
Resources can be intimidating at first, but bear with me, it’s not that hard an can be very useful.
A usual, you’ll need the the proper information in relation to your project.
Note that the following tables are fictitious, for the purpose of this exercise only, not to be used as a guide to the maintenance of a 930 truck.
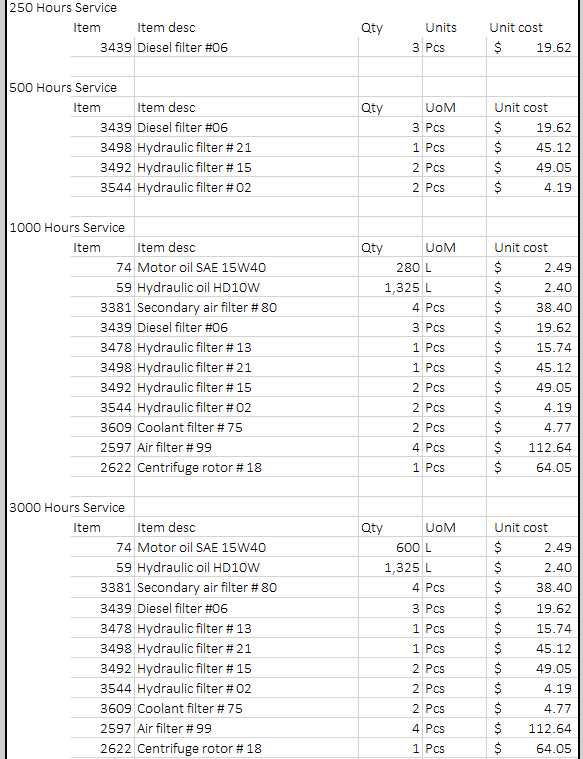
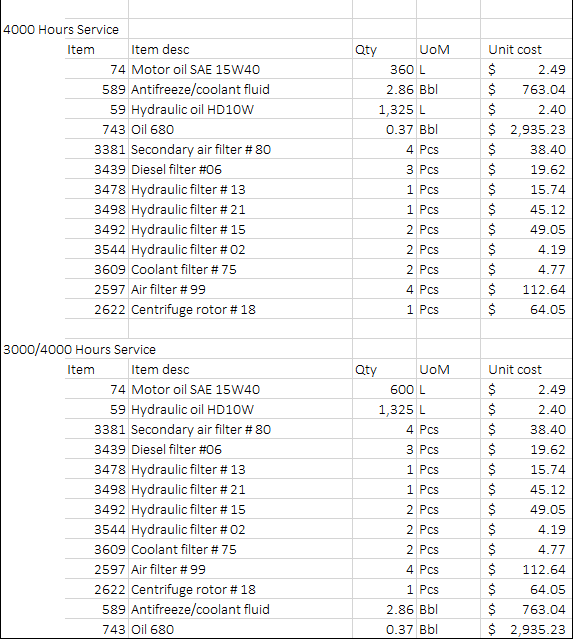
Now that we’ve collected the information, simply enter them in the resource sheet, using the following headings; Resource Name, Type, Standard Rate, Currency, Units, Base Calendar (Currency and Units are custom fields (Text1, Text2). I’m not using currency for this example but it’s very common in an international environment.
You can also customize your headings, add part numbers, etc…


You can enter rates for the trucks or mechanics if necessary. Also check if you need to create a calendar for your labour forces (Mechanics, techs and welders). Are they working only during the week, or 7 days a week, day and night shift, etc…)?
Now enter these resources in your tasks

Note the units for the Mechanic; since we need 2 workers x 1 hour and 2 workers for 3 hours = 8 man hour total divided by the 4 hour service time = 2 units (or man hours).
I want to record a total of 8 man hours for the mechanics for the 250 hour service. Same for the welders.
The cost for the materials will be calculated automatically
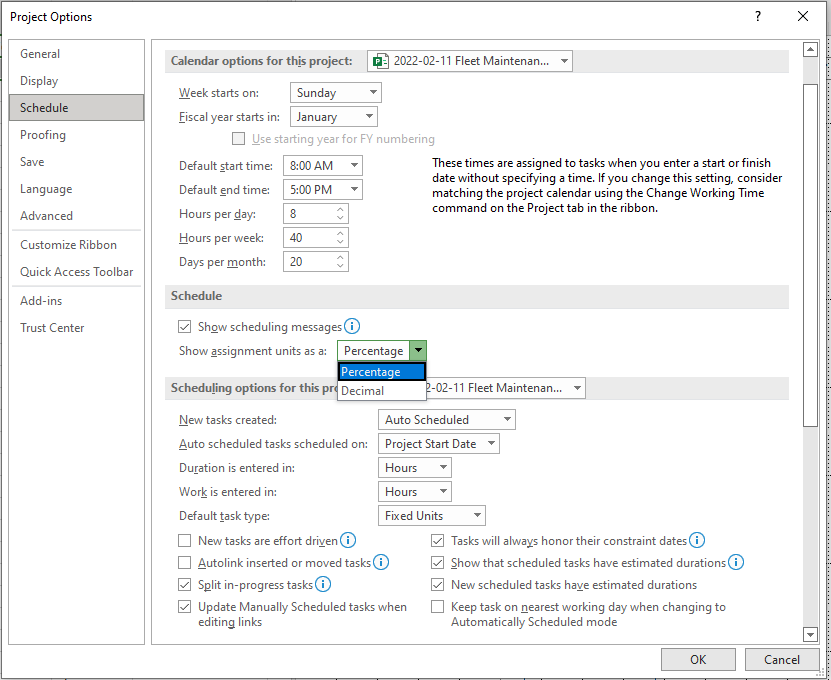
Also note that the default units for work is in percentage. You can change it to decimal in the options screen.
You only have to enter it once per service, then copy paste the rest.

Rince and repeat for all of the services.
Once your done, here’s what you can do with it;
Just ask for a “Resource Usage” view, change a few things, play with the timescale, make it look like this, and you can predict exactly what materials you’ll need and the cost for each day, month or year in the future. Same with labour if you choose to include it.
